Data Analytics
Classic Models Sales Analysis
Relational sales analysis in MySQL with a multi-page Power BI dashboard covering products, offices, customers and shipments.
- MySQL
- Power BI
- CTEs
- Window Functions
Problem
Sales data for a model-vehicle retailer was spread across related tables for orders, customers, products, payments and offices, making it hard to see where profit came from and where risk sat.
Approach
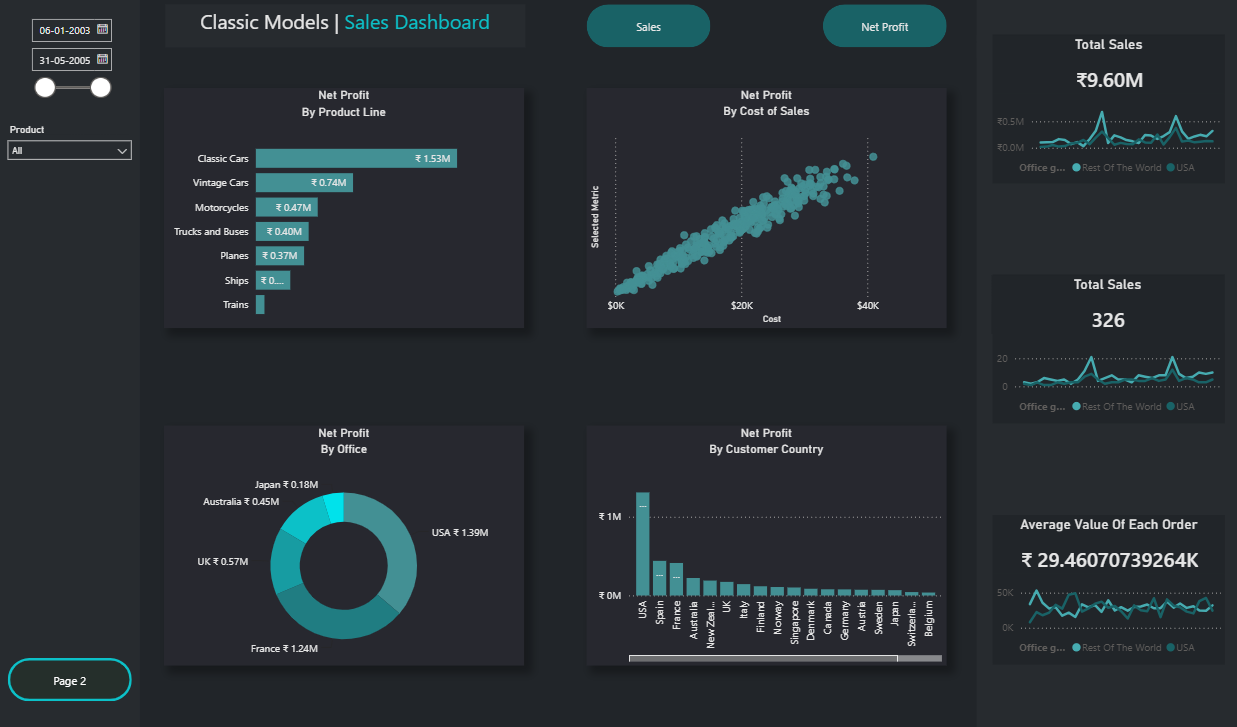
Wrote MySQL queries using multi-table JOINs, CTEs, subqueries and window functions (ROW_NUMBER, LEAD, LAG) to build analysis-ready views, then modelled them in Power BI as an interactive multi-page dashboard.
Key features
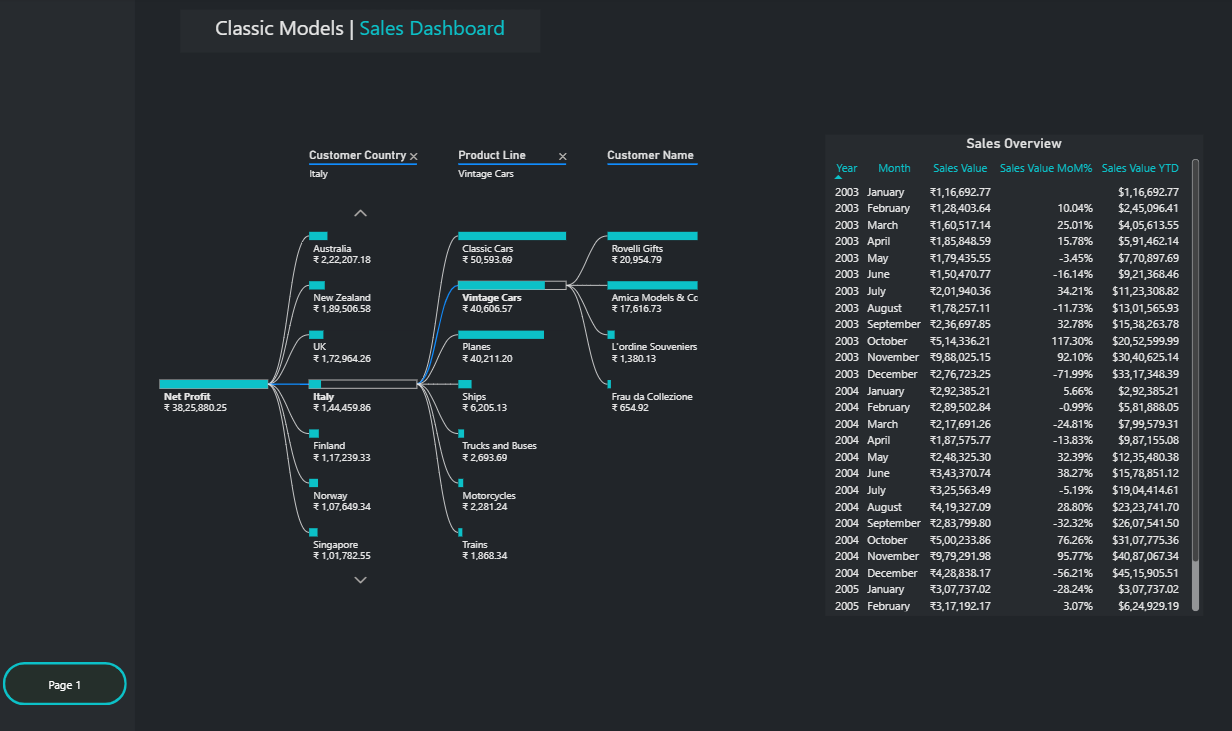
- 01Decomposition tree breaking net profit down by customer country, product line and customer
- 02Scatter plot of net profit against cost of sales, plus donut and bar breakdowns by office and country
- 03Month-over-month and year-to-date sales overview
- 04Customer credit analysis to surface at-risk accounts
- 05Late shipment impact assessment across regional offices
Evidence
Next project
Advanced RAG Knowledge Assistant